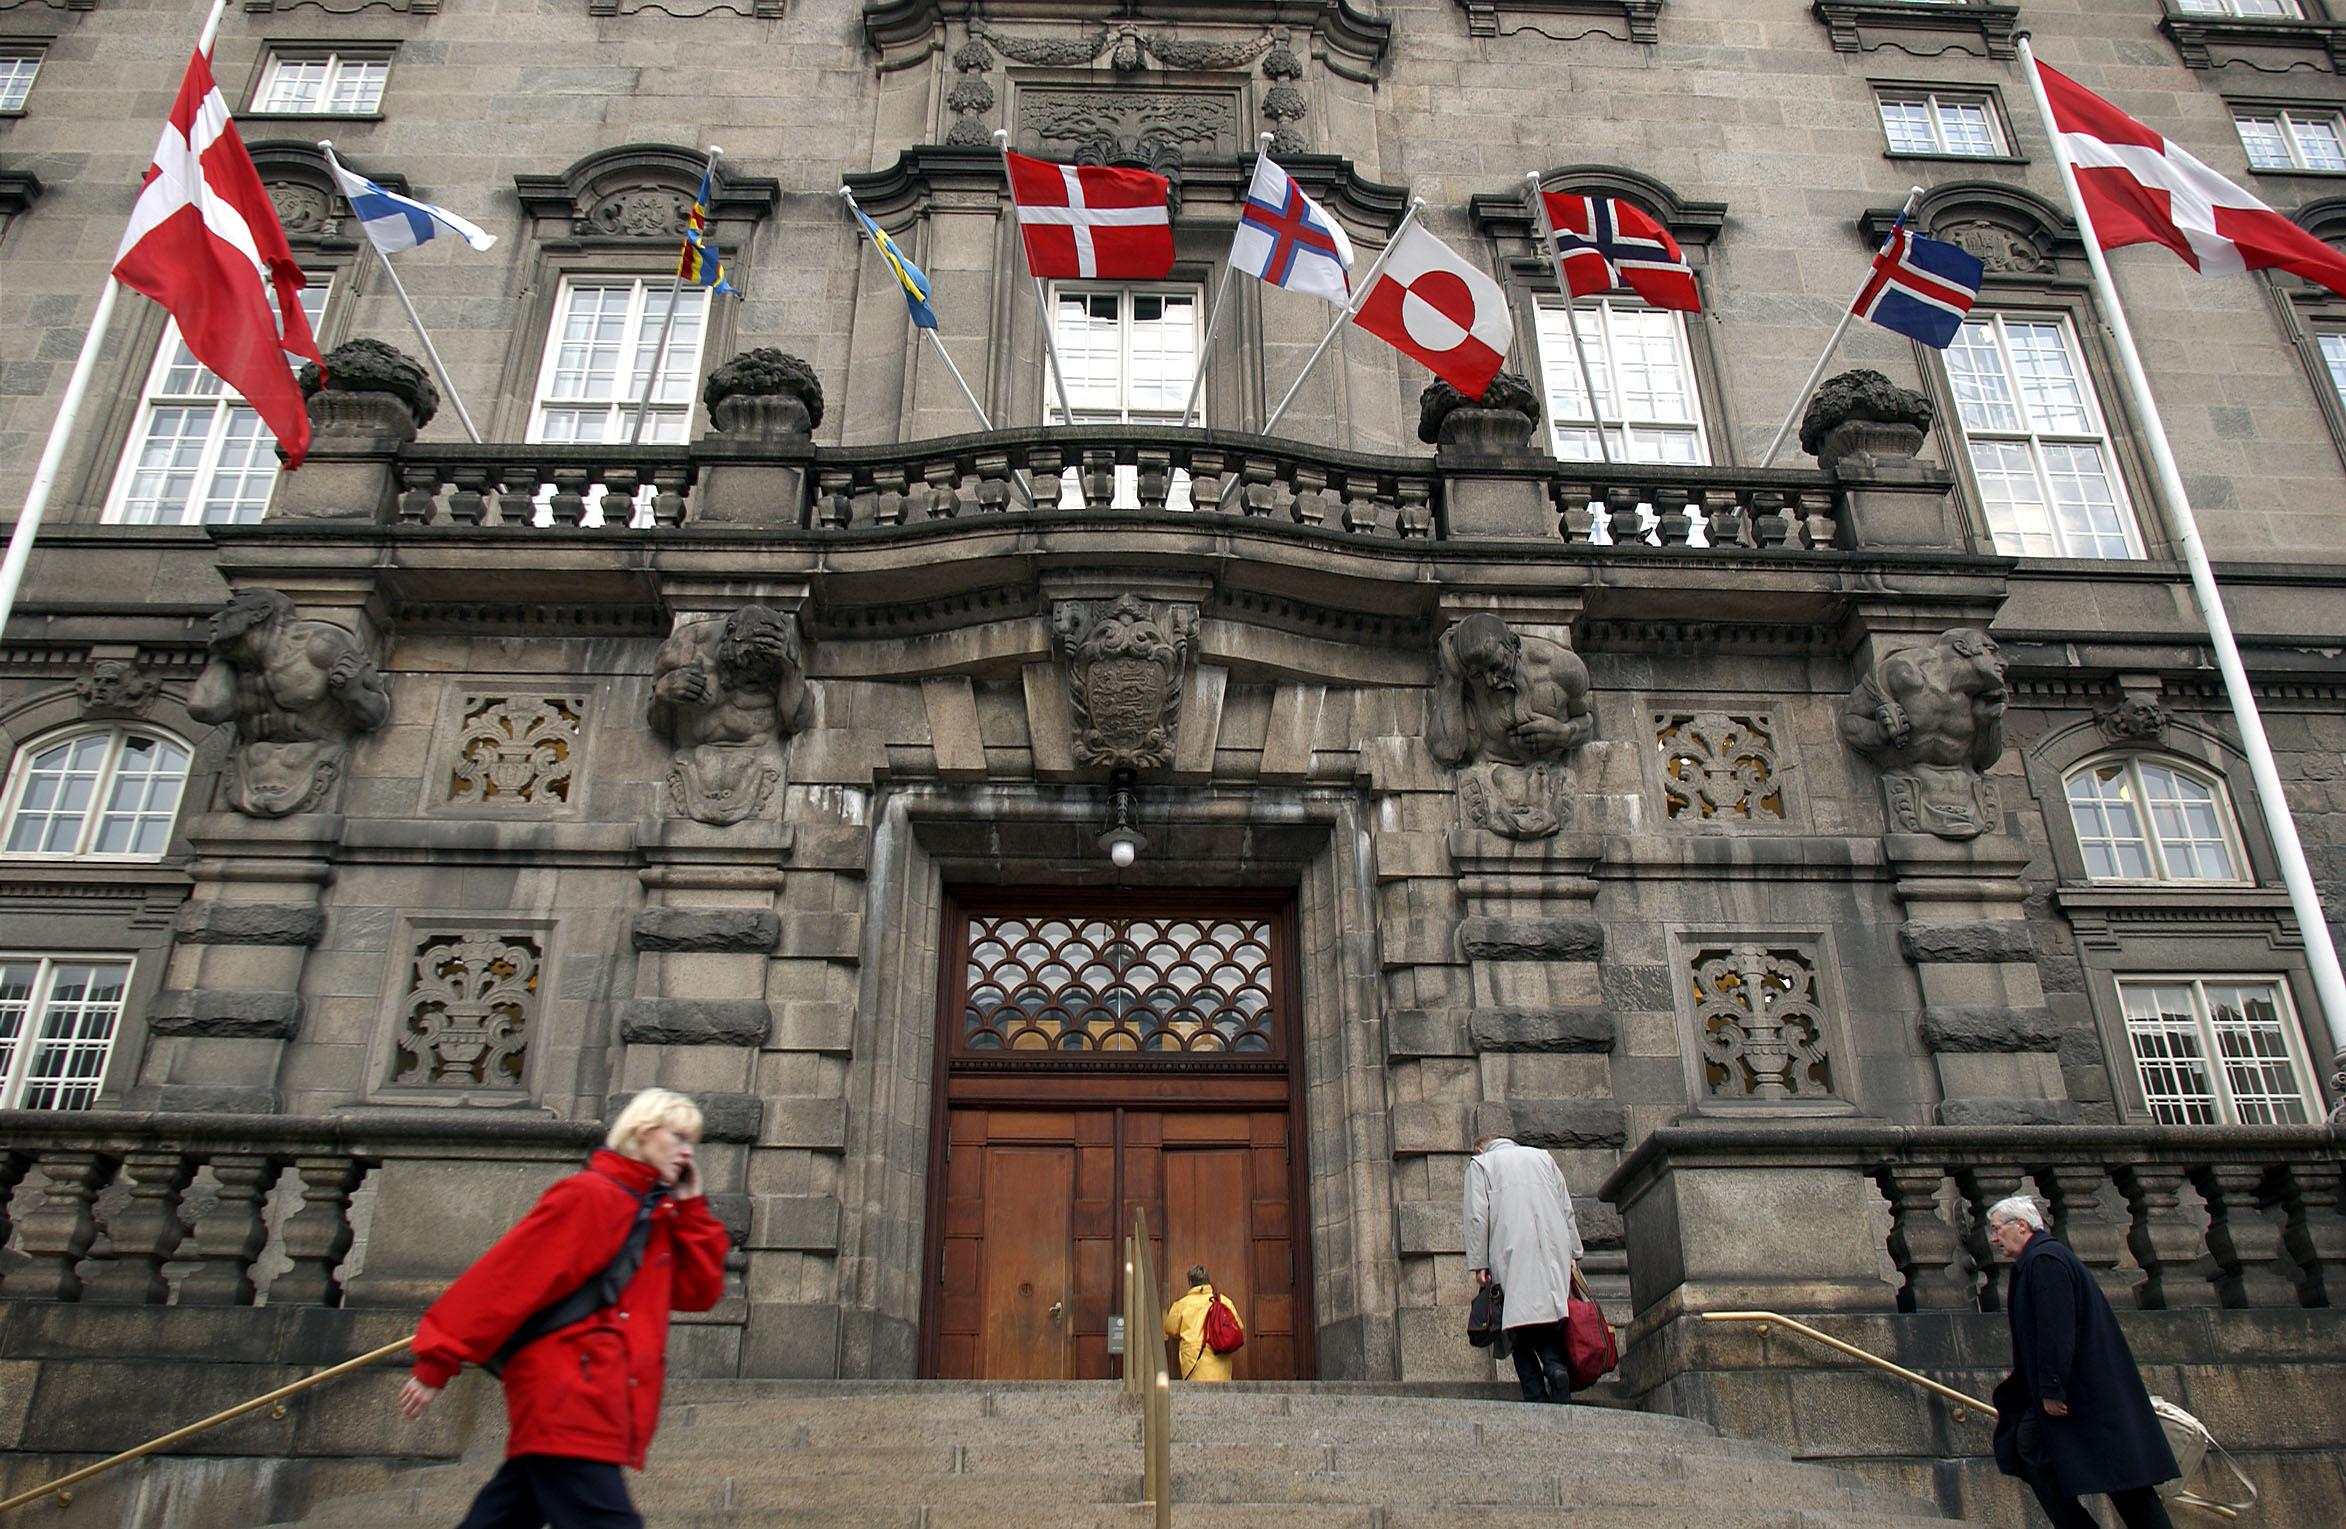
The Nordic Statistics Database, a collaboration between the Nordic Council of Ministers and the Swedish statistics and research company Statisticon, has undergone huge developments. This will benefit anyone working with comparative Nordic assessment statistics in working life.
Improved Nordic labour market statistics provide much improved insights
The number of tables has grown from 3 to 28 and statistics are now even more up-to-date. It is also possible to choose which countries to compare and easy to shorten or lengthen the time period you want to analyse. In addition, differences in the statistics are now explained to avoid pitfalls.
You can find all the statistics here:
Here we bring you on a brief statistical journey which showcases some of the major differences between the Nordic countries right now.
Gross domestic product in PPS/euro by reporting country, unit and time. Åland is here shown seperately from Finland. Source: Nordic Statistics database
We begin with GDP, where Norway really has stood out in recent years. The reason behind Norway’s considerable GDP growth is Russia’s invasion of Ukraine in 2022. That made natural gas prices soar. Yet although Norway’s GDP rose a lot, it does not mean the citizens got that much more money. Most of the revenue is being saved in Norway’s oil fund.
"Out of all the European countries, Norway has made the most money from the crisis so far. Our extra revenue has already surpassed 1,500 billion kroner (€127bn) mainly from higher energy prices and especially gas," writes Bård Standal, deputy leader for the employers' organisation Renewables Norway.
The Corona pandemic was another transformative event. It caused a rapid rise in unemployment rates in the Nordic countries, yet far less than in the USA which lacks a comparative welfare safety net.
The figure displays the harmonised index of consumer prices by reporting country and time. Annual figures on the left, the monthly index compared to the same month the previous year on the right.
The pandemic also led to higher inflation. The graph above is one example of the importance of fresh statistics. If you only look at the annual statistics on the left, it looks like all the countries are still experiencing rising inflation. The monthly statistics from September 2022 paint a different picture. They show the change in the monthly index of consumer prices compared to the same month the year before.
The figure displays the employment rate by reporting country and time.
The employment rate differs considerably between the Nordic countries. It is higher in all of them compared to the EU average, yet Iceland stands out with an employment rate of almost 88 per cent. Finland's rate is more than ten percentage points lower. However, if the Faroe Islands had been shown separately from Denmark they would be on top with an employment rate of 90 per cent.
The share of employed individuals aged 16-64 years who declare that they have been absent from work for the whole reference week.
Some of the largest differences are found in the statistics covering sick leave. Norway is considerably ahead of the other countries in terms of the number of people who are too ill to work. The reason? Norwegian rules for sick leave are the most generous in the whole of the Nordics. There are no waiting days when individuals must fund their own absence.
That means employees do not lose any money if they are off sick for shorter periods of time. The employer covers the cost for the first 16 days of sickness, after that the Norwegian Labour and Welfare Administration (NAV) covers the cost.
The Corona pandemic also shows up in the statistics for workplace injuries. It might look like Denmark has suffered a significantly worse trend than the other Nordic countries.
But a footnote explains that Denmark classifies Corona as an occupational injury if the individual was infected as a result of their job. The other countries do not count Corona in the same way.
Provides comprehensive statistics across a range of subjects, from environment, geography and science to health, elections and the labour market.
The Nordic Statistics database has expanded its parameters covering the labour market in the Nordic Region, including the economy, demography, employment, unemployment, work-related accidents and absences from work. The Labour market section in the Nordic Statistics database can be found here.