Norway falling on integration index – or is it?
Over the past five years, Norway has lost its position among the top ten countries with the most inclusive and generous migration policy, according to MIPEX 2020. But what does that really mean?
The report from MIPEX – an international tool measuring the integration policies of 52 countries – might read like a dramatic fall for Norway. The figure is for 2019, when Norway got an index number of 69, down from 72 five years earlier. The index goes up to 100.
MIPEX presents a report approximately every five years. Right now the results form the 2020 report are being rolled out. To increase the suspense and keep people’s attention, this happens one country at a time. The countries that have been presented so far are the Czech Republic, Portugal, Norway, Estonia, India, Japan and China. So we still do not know which ten countries have better integration policies than Norway.
We will not know this until 9 December when the entire report will be launched. The only other Nordic country besides Norway that gets its own presentation for its index numbers is Iceland. That happens on 27 November.
So what does the index number say about Norway?
“The number does not show how well-integrated immigrants in Norway are,” underlines researcher Jan-Paul Brekke at the Institute for Social Affairs, ISF.
That is because there is no direct correlation between the nature of the migration policy and how well immigrants are integrated. Migration researches have pointed out that a country with very strict policies, where only migrants with high education levels are allowed to settle, will see better integration than a country with more open borders. MIPEX also does not measure asylum seekers, only labour immigrants and their families.
“But the numbers are interesting and allow us to discuss the changes that have been made to integration policies in recent years,” says Jan-Paul Brekke.
ISF researchers have provided MIPEX with information on Norway, and the institute recently hosted a webinar about the new results.
The Norwegian middle way
“Norway has chosen a middle way compared to its Nordic neighbours. The country is behind the more inclusive Finland and Sweden, but somewhat ahead of its more restrictive neighbours Denmark and Iceland,” says Thomas Huddleston, director of MIPEX.
MIPEX is partly financed by the EU and studies integration policy across eight areas. One is whether migrants and equally treated in the labour market, others look at access to nationality, anti-discrimination measures and immigrants’ access to education and health.
Each area is given an index number. The average across the eight areas is used as the final “grade” for a country’s policy.
“Norway scores high on labour mobility, where they are joint fourth with Canada, Germany and the other Nordic countries,” says Thomas Huddleston.
“But family reunion policies are more problematic, since Norway has introduced decisive obstacles to the reunification of families,” he points out.
“Norway’s current position encourages citizens to treat immigrants as their neighbours, but not necessarily as their equals or fellow citizens,” the report on Norway from MIPEX 2020 says.
According to MIPEX’ website, the index is the most comprehensive, reliable and commonly used tool to compare what governments do to improve the integration of migrants in Europe and the rest of the world.
The link between policies and integration might be less than crystal clear. Yet the MIPEX researchers still argue that political decisions – like how long people must have lived in a country to become eligible for citizenship – send signals about how welcome migrants are.
Indexes are important tools to measure changes over time. The one we perhaps most often hear about is the index measuring inflation – the consumer price index, or CPI. It measures what different goods and services cost year on year. Sweden’s CPI has been measured for every year since 1830. It is also clear that what we consume changes over time – we do not buy the same things now as we did in 1830. The “consumer basket” has gradually changed.
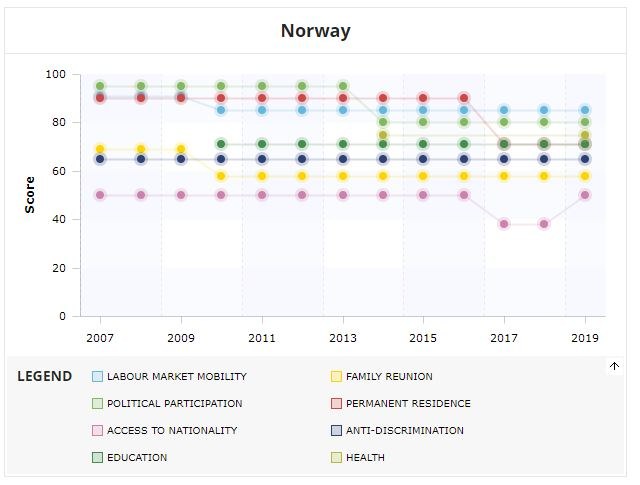
The MIPEX index has changed over time too, although it might not seem that way when you look at the time series 2007 to 2020 presented in the latest report:

It might seem like the exact same question has been posed all these years. In reality, major changes have been made since the first report was published in 2004, under a different name and covering far fewer countries and areas. This is how it has developed:
The aim of the first MIPEX report in 2004, (then called the European Civic Citizenship and Inclusion Index) was to create a tool that did not exist in the EU yet. The lack of reliable, comparable statistics “makes it impossible to tell whether Member States are achieving their own targets and whether they are living up to the commitments they have made. Whilst countries systematically collect data on every cow and chicken in the EU as part of the Common Agricultural Policy (CAP), migration is apparently too politically sensitive, and Member States too different, for systematic, comprehensible data to be collected” the first report noted.
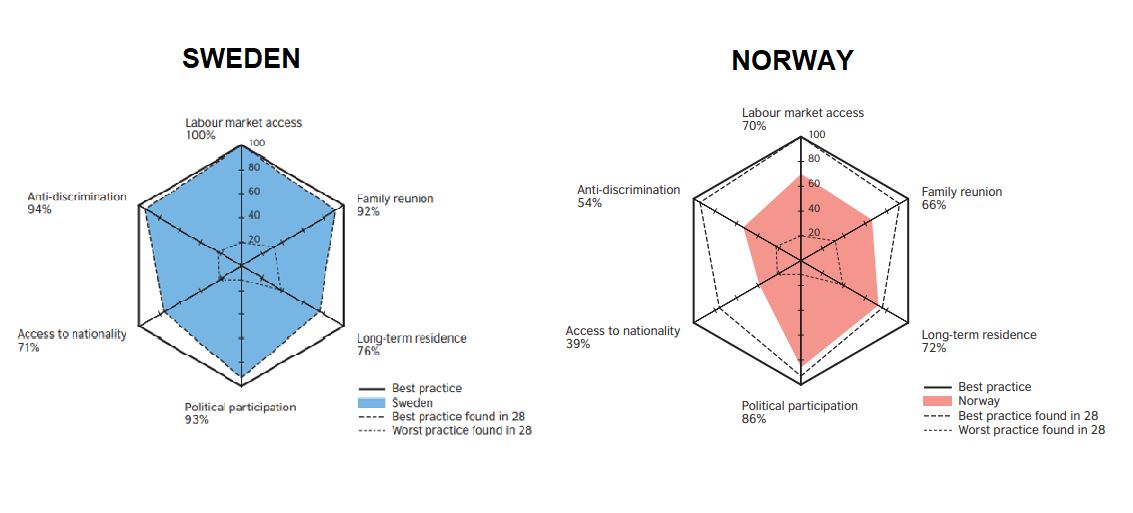
At first, the idea behind the MIPEX reports was indeed for them to be an instrument to help the EU make decisions. Using spindle diagrams it was possible to compare different countries policies, like in this one looking at Sweden and Norway from the 2007 report:

The more an area is coloured in, the more generous the migration policy. The outlines show best practice vs worst practice within the EU. Norway was compared in the same way, even though the country is not a member state. At the time, Sweden had the best practice of all the EU countries.
The gathering of data gradually grew more challenging as the number of countries in the MIPEX reports grew from 15 to 52, new aspects like health and education were included and the number of questions increased from 99 to 167 by 2015.
In this year’s report, the number of questions has been dropped to 58. MIPEX says it has been possible to do this without changing the countries’ ranking or dropping any of the index’s measurements. According to the MIPEX home page:
In the fifth edition (MIPEX 2020), we created a core set of indicators that have been updated for the period 2014-2019. MIPEX now covers the period 2007-2019.
The research process started with the revision of MIPEX indicators. In order to ensure MIPEX sustainability over time, we decided to select a core set of indicators from the original list of 167 indicators from MIPEX 2015.
In other words, all MIPEX indicators are simply not necessary—if a country has Policy A, it’s highly likely to have Policy B, C, D and E, which means that MIPEX only needs an Indicator of A and not 4 additional indicators on B, C, D and E.
In the CPI comparison, it would have been like if the national statistics had cut the number of products and services measured by approximately two thirds. The argument could have been that those who bought nappies also bought baby food (if these goods were part of CPI), and that it was sufficient to include the price for just one of those products. The researchers behind MIPEX, however, claims that the similar reduction of policy questions fro 167 to 58 doesn't affect the index very much:
The scores produced by the core set of indicators are consistent with the scores from the MIPEX' full set of indicators and reproduces the same national rankings and trends.
The reason the Index for Norway changes was that the country 2017 introduced a minimum earning threshold for residency permits, as well as language and civic studies tests for those who wanted to become Norwegian citizens . On the positive side, from 2020 it has been possible for immigrants to have dual citizenship.
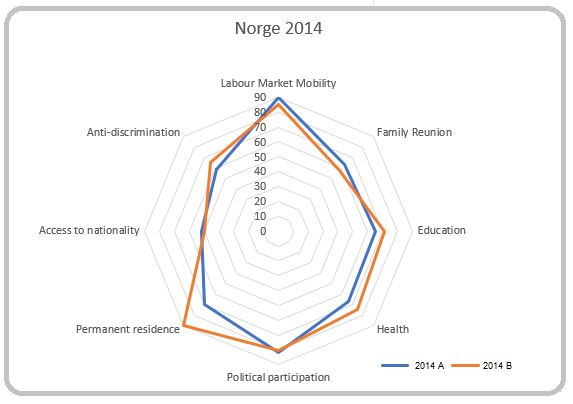
So the message could have been: Norway climbs in the MIPEX index from 68 to 69 if you look at the period from 2018 to 2019. The country no longer features in the top ten countries with the best integration policies, but on the other hand, it is now number 11 out of 52 countries rather than 38. It is also possible to compare the new index with the old one:

The spindle diagram above – created by the NLJ – shows Norway’s spindle position from the 2015 report compared to what the 2020 report shows for the same year. The answers in both refer to the year 2014. As can be seen the fit is not perfect.
- The fit is not perfect, but the researchers at MIPEX have interviewed or written with leading experts on integration policies in the 52 countries, to assess the importance of indicators for each area and select the most relevant key indicators. This core set of indicators represents the smallest set of indicators that provides the most accurate and comprehensive picture of the integration policy situation in a country, says Giacomo Solana, one of the researchers behind the MIPEX index.

 Follow us on Facebook
