The fight against labour crime and social dumping will remain high on the agenda, as will issues surrounding AI and the Nordic model.
One of the Presidency’s top priorities will be to secure an update to the Helsinki Treaty to reflect that Nordic cooperation is between eight countries.
The Helsinki Treaty regulates the Nordic co-operation and is often referred to as the “Nordic constitution”. It was adopted in 1962 and was last updated in 1996.
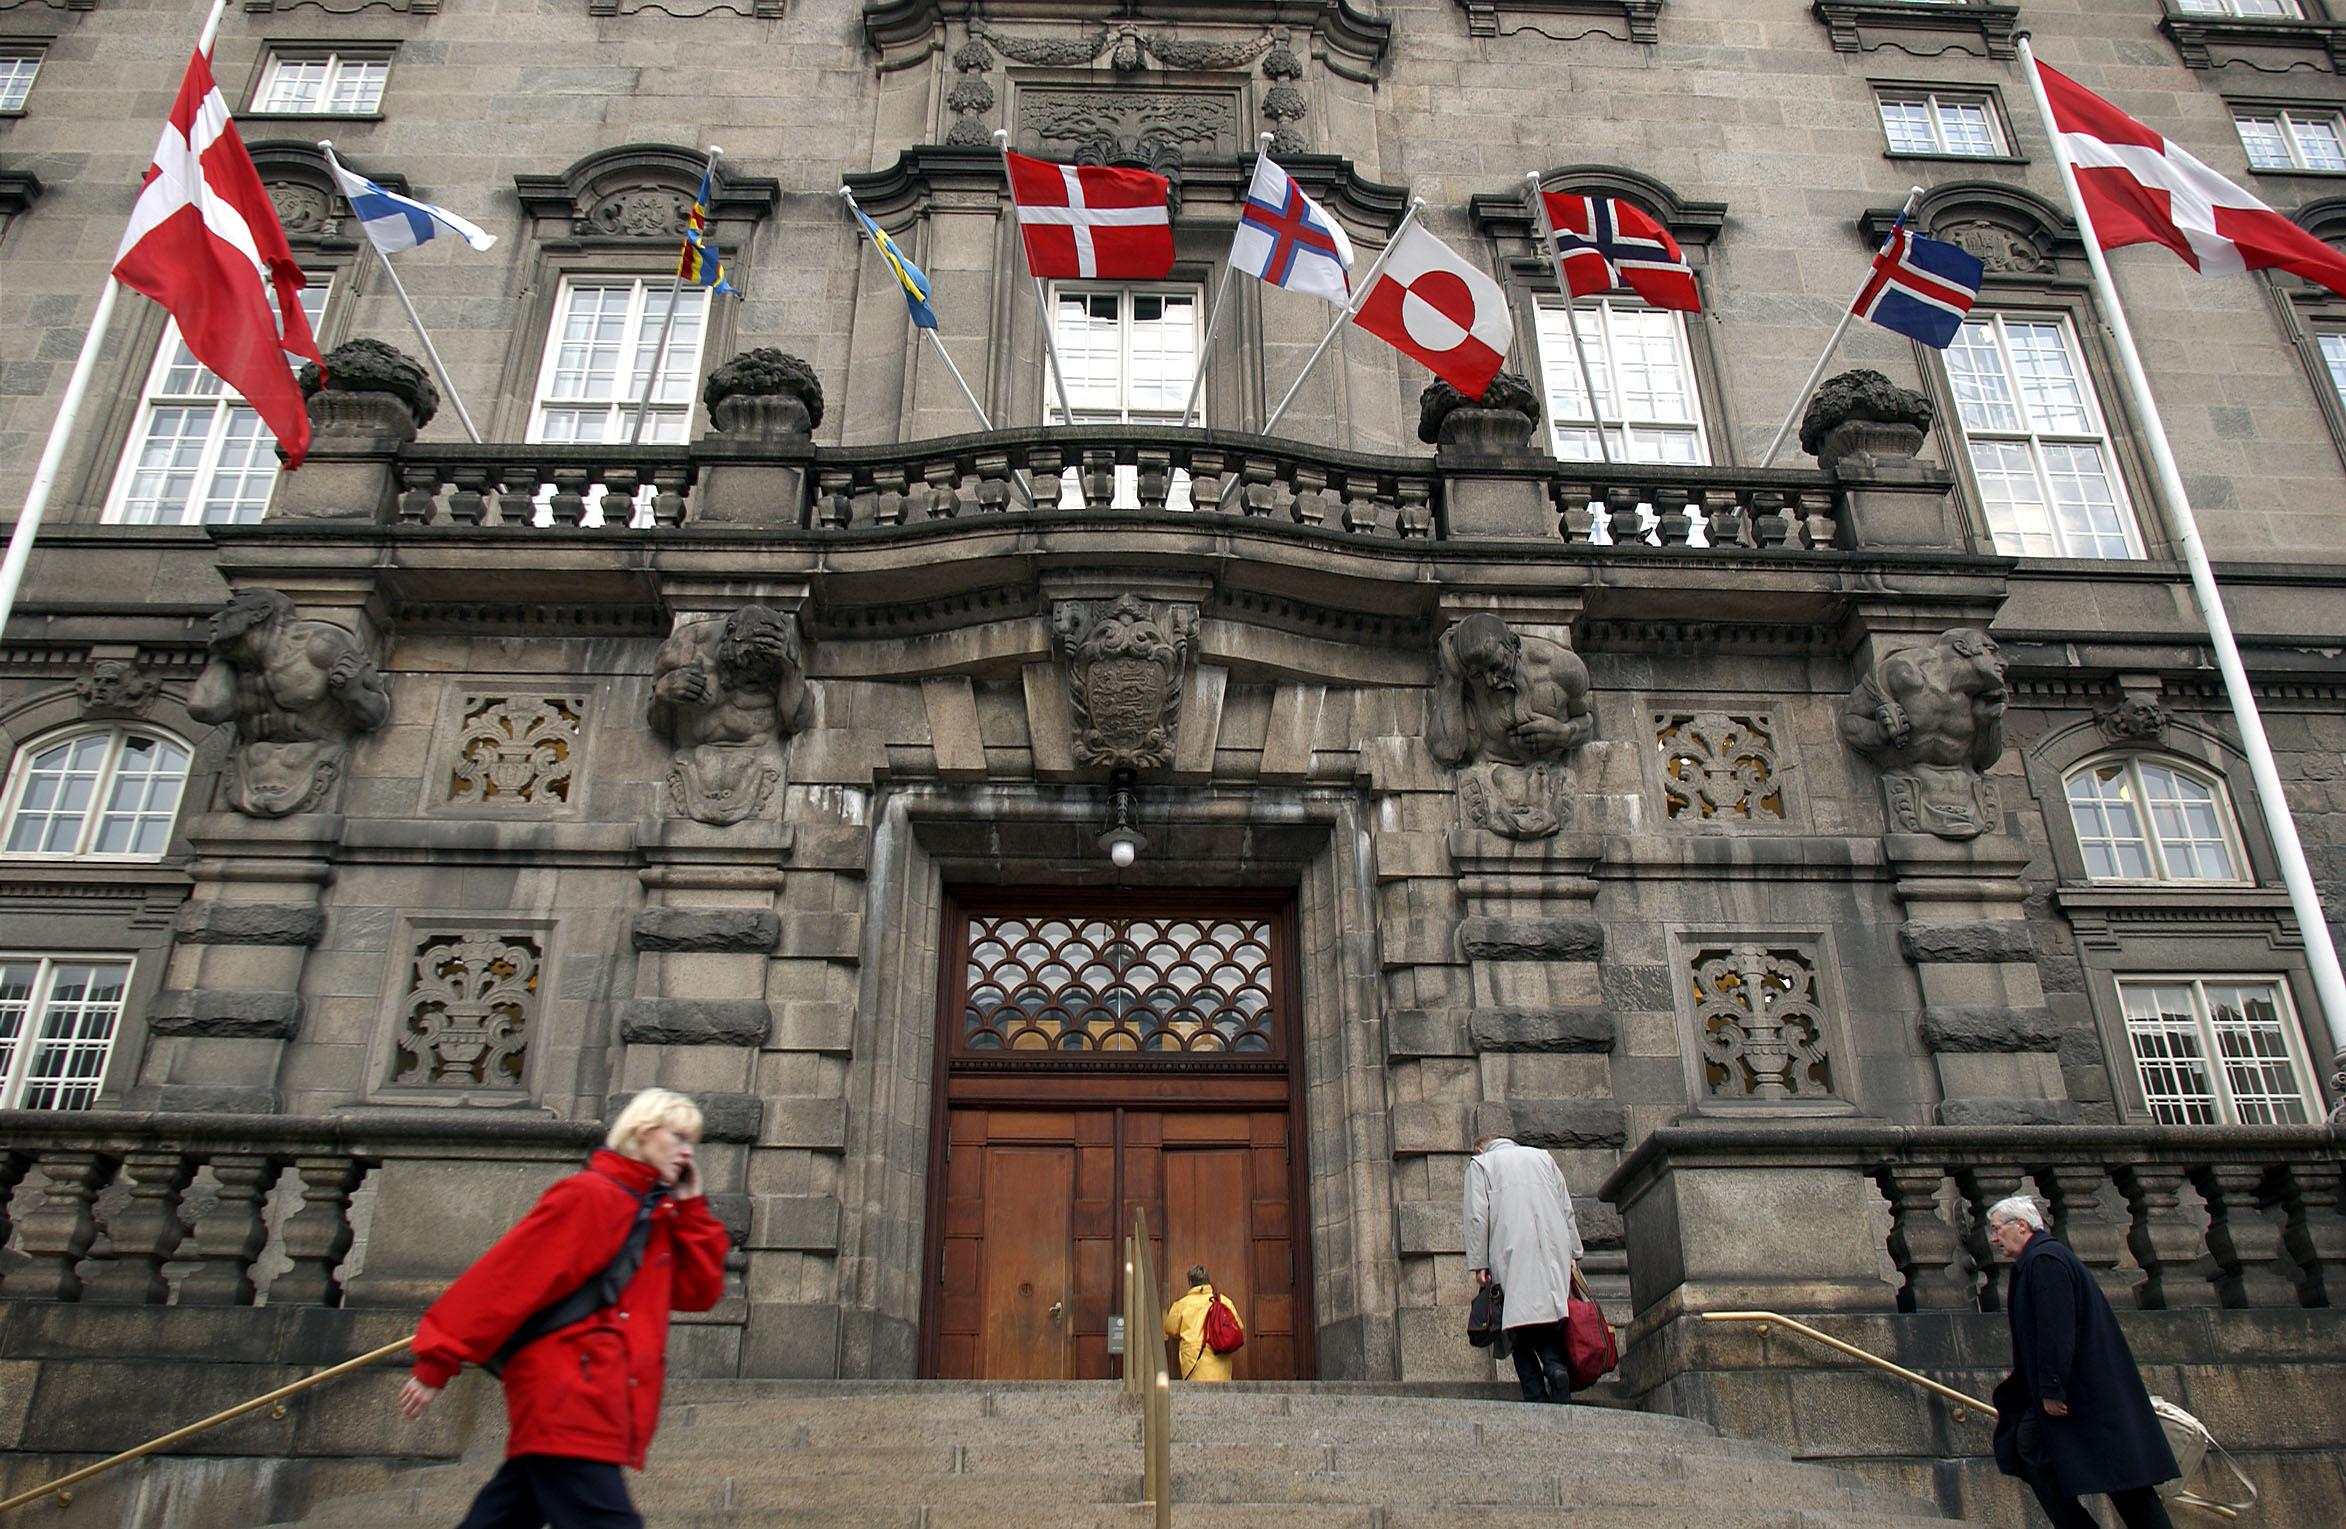
The Presidency will give Greenland and the Faroe Islands – and Åland, if Åland and Finland want to – equal participation in Nordic cooperation with the other Nordic countries.
Denmark’s Minister for Nordic Cooperation, Morten Dahlin, said the following on the Council’s website:
“The position of the Danish government is clear: We share the Faroese and Greenlandic desire for the Faroe Islands and Greenland to have the opportunity for full participation in Nordic co-operation on an equal footing with the other Nordic countries. This opportunity would, of course, also apply to Åland, should Åland and Finland so wish. I look forward to leading these efforts.”
During the Presidency, Denmark and the Faroe Islands will work towards creating even closer Nordic cooperation around societal and supply security, cross-border crime, the region’s overall competitiveness and the protection of children and young people in the digital age.
Read the Presidency’s programme here (in Danish): Norden 2026: Forbundne i skiftende tider. Danmarks og Færøernes formandskab for Nordisk Ministerråd 2026